
Q: How can I illustrate an adaptive intervention with a schematic?
A: A schematic is a powerful tool for communicating the structure and features of an adaptive intervention. However, developing a schematic requires a trade-off between detail and clarity. A schematic that displays every feature of an adaptive intervention with perfect accuracy will likely appear cluttered and reduce comprehension. Scientists must consider what they want their audience to understand about the depicted adaptive intervention, then choose what details to emphasize and what details to omit accordingly.
The schematic below shows a two-stage, nine-week adaptive intervention with two decision points—one concurrent with an emergency department visit at week 0 and the second at the end of week 4. It also shows that response status is the tailoring variable at week 4. At this decision point, non-responders are switched to intervention B, while responders continue to receive intervention A. The second-stage of intervention continues until week 9.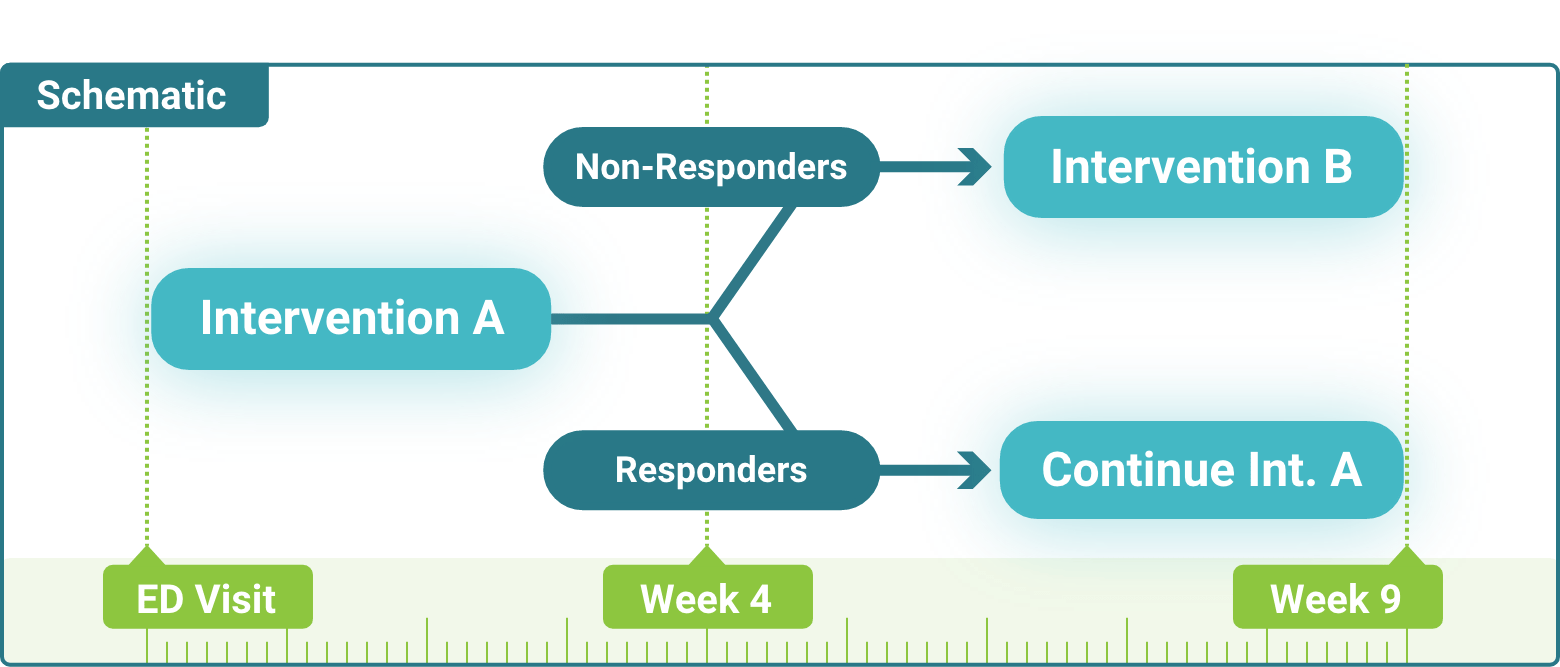
Let’s identify some choices implicit in this schematic and identify the impact of those choices.
By highlighting the two decision points and the end point of this adaptive intervention, the developer of this schematic emphasized the timeline of intervention and adaptation. By omitting details about the definition of response and which emergency department patients will be offered this intervention, the developer deemphasized the rationale behind tailoring but preserved white space inside the schematic box, allowing for a clearer presentation of the adaptive intervention’s structural elements. By not drawing the intervention boxes to scale (e.g., “Intervention A” begins at “ED Visit” but does not extend to “Week 4,” even though intervention A continues until week 4) the developer left room for connecting lines and directional arrows, further enhancing the communication of the adaptive intervention’s structure. Together, these choices produced a schematic that foregrounds the structure of the depicted adaptive intervention and conveys a sense of how that structure plays out across key time points.
Often a schematic is just one part of communicating the full depth of an adaptive intervention—it may appear alongside text that describes the relevant intervention options, tailoring variables, and decision rules, or with other schematics, each displaying a particular cross-section of information about the same adaptive intervention.
Below are some novel variations on adaptive intervention schematics.

This hypothetical adaptive intervention schematic emphasizes the recommendation of multiple intervention components at the same decision point. Background shading encapsulating two intervention boxes indicates that both “add low dose medication” and “intensify behavioral intervention” belong to the same recommendation, and that the choice of intervention is left up to the clinician.
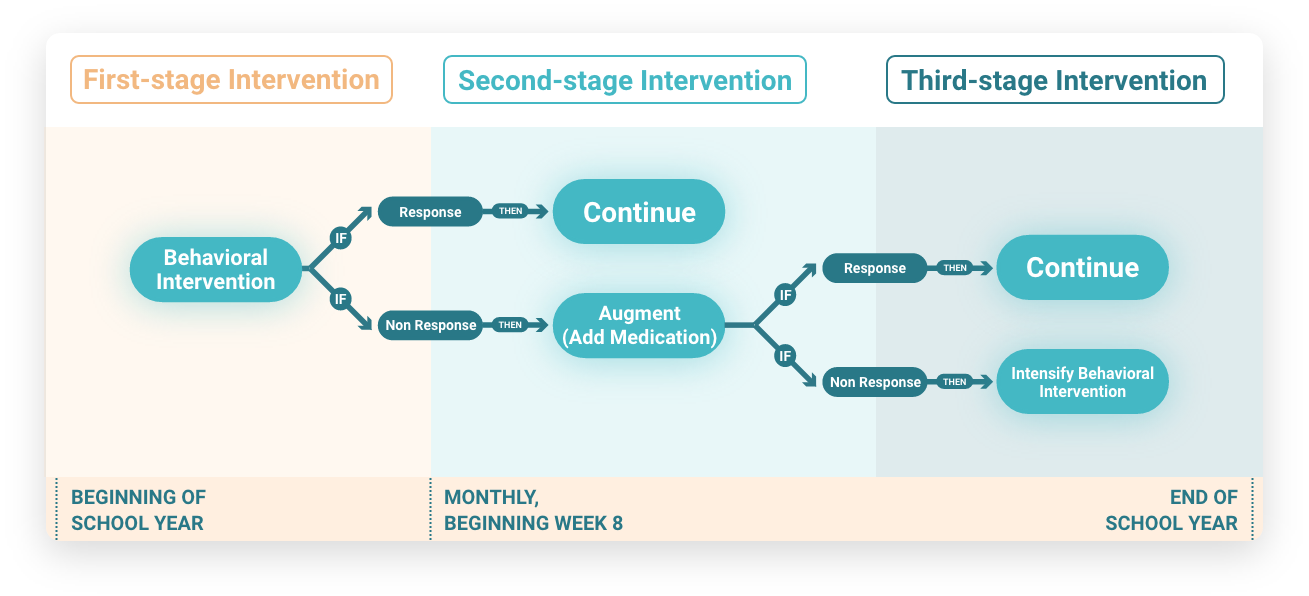
This hypothetical adaptive intervention schematic emphasizes the conditional logic behind the process of adaptation across three stages with directional arrows labeled “if” and “then.” It also emphasizes the transitions between three stages with background shading.

This hypothetical adaptive intervention schematic emphasizes the questions implicit in three distinct decision rules across two decision points. At the first decision point, the question demonstrates the application of tailoring at baseline. At the second decision point, between stage 1 and stage 2, these questions demonstrate that two different tailoring variables may be applied at the same time point depending on which first-stage intervention the patient received.
LET’S STAY IN TOUCH
Join the d3center Mailing List
Keep up to date with the latest news, events, software releases, learning modules, and resources from the d3center.